
Dubai market data
Population, yields, area comparisons and developer sales — the context behind our advice. Market data, not a forecast of returns.
Why Dubai?

in the world
- BANGKOK
- PARIS
- LONDON
- DUBAI
- SINGAPORE

in the world to live in


visitors in 2025 · +5%Dubai DET
DUBAI'S
POPULATION1980 – 2025
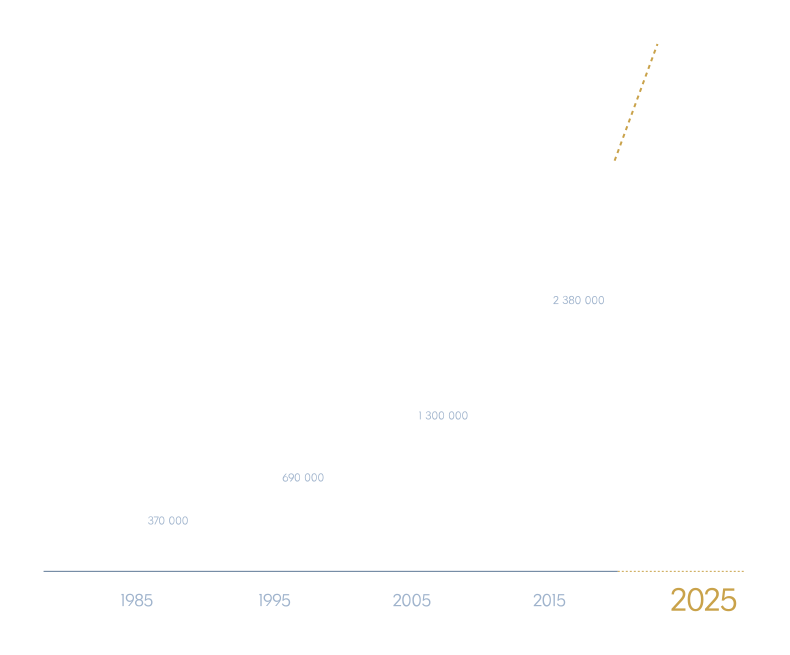
according to
www.dsc.gov.ae
Why UAE real estate?
- 01
0%
No tax on income, dividends, salaries or capital gains for individual investors.
- 02
INSTALLMENTS
Interest-free instalment plans for the entire construction period.
For example: 40% during construction, 60% on handover - 03
RESIDENCE VISA
Property from AED 750,000 can qualify you for a 2-year residence visa, and from AED 2 million for the 10-year Golden Visa.
- 04
UNDERESTIMATED
A strong economy, a simplified mortgage process and prices still below other global cities keep pushing Dubai's property sector towards growth.
- 05
PROTECTED
Off-plan payments go into RERA-regulated escrow accounts and are released to developers only as construction progresses.
- 06
HOLIDAY HOMES
Dubai is one of the world's strongest short-term rental markets — licensed holiday homes earn from year-round tourism.
Dubai's reputation keeps rising — and that is critical to rising real estate prices.
What investors typically see in Dubai
Market averages, not a guarantee of returns. We model the numbers for your exact unit.

REALTY L.L.C Team
Compare Dubai's top areas
Real transaction data, side by side — so you can see where your money buys more and where it earns more.
Average apartment price per sq ft, DLD transactions 1 Jan – 6 Jun 2026. Source: Property Monitor via Engel & Völkers.
Average gross apartment rental yield, August 2026. Source: Property Monitor via Engel & Völkers.
Average registered office rent per sq ft per year, 2026 to May. Source: Property Monitor via Engel & Völkers.
Head to head
Pick two areas to compare a 1,000 sq ft apartment. Gold marks the better figure on each line.
Price and yield: Property Monitor (DLD transactions), Jan–Jun 2026 prices and Aug 2026 yields, via Engel & Völkers. Estimated rent = price × yield, before service charges. Averages only — individual units vary.
Dubai vs the world's great cities
How prime property in Dubai compares with London, New York, Singapore, Hong Kong, Paris, Tokyo, Mumbai and more — on growth, value and rent.
Change in prime residential price per sq m in US dollars, 2020 → 2025, derived from Knight Frank's “How much prime property does US$1m buy?” (The Wealth Report 2026). US-dollar terms include currency moves.
Change in prime residential price per sq m in US dollars, 2024 → 2025, derived from Knight Frank, The Wealth Report 2026. In local currency, Knight Frank's PIRI 100 ranks Dubai 2nd in the world for 2025 at +25.1%.
Square metres of prime residential property US$1 million buys, 2025. Source: Knight Frank, The Wealth Report 2026.
Prime yields: Savills World Cities Prime Residential Index, December 2025 — in Savills' prime-only ranking of 30 world cities, Dubai had the 3rd highest yield, behind Los Angeles and New York. Dubai all-apartment yield: Property Monitor, August 2026. Gross yields, before costs and taxes; Dubai has no tax on rental income.
Past performance does not guarantee future returns. Savills forecasts Dubai prime values to grow 0–1.9% in 2026 after an exceptional run. Figures last checked October 2026.
Dubai developer sales leaderboard 2026
Who is selling the most right now — ranked by registered sales from 1 January to 31 August 2026.
- 01
 AED 32.3B6,039 sales
- 02
 AED 18.2B7,102 sales
- 03AZIZIAED 10.6B12,256 sales
- 04
 AED 9.3B5,873 sales
- 05
 AED 8.7B2,986 sales
- 06
 AED 7.9B986 sales
- 07
 AED 7.4B971 sales
- 08
 AED 7.3B1,545 sales
- 09
 AED 7.0B2,166 sales
- 10IMTIAZAED 4.1B2,670 sales
- 01AZIZI12,256sales
- 027,102sales
- 036,039sales
- 045,873sales
- 052,986sales
- 06IMTIAZ2,670sales
- 07
 2,197sales
- 082,166sales
- 09
 1,946sales
- 10REPORTAGE1,880sales
Source: DXB Interact data via Engel & Völkers, sales recorded 1 January – 31 August 2026. Sales volume and value measure demand, not build quality — we check delivery record and escrow for every project we recommend.
Want these numbers applied to your budget?
Tell us what you are looking for and our team will reply within 4 working hours.